How to implement EKL Stack in Spring Boot Microservices Architecture!
Hello Developers,
Today we are going to see one of the most important factor in spring boot microservices which is distributed logging, how we can enable distributed logging in Spring Boot Microservices based architecture. Here I am showing using local windows machine this can be reproduce in production grade application using any cloud like AWS (Amazon Web Services). This will be cover in next upcoming blog.
 |
| Elasticsearch, Logstash, and Kibana in Spring Boot Microservices Architecture. |
What is ELK?
ELK stands for Elastic Search, Logstash and Kibana respectively. It is a very powerful and widely use open-source centralized logging, log analysis and visualization library or software's.
- Elasticsearch: It is a distributed search and analytics engine that stores and indexes data. Elasticsearch allows for fast and efficient searching, aggregating, and analyzing of large volumes of data.
- Logstash: It is a data processing pipeline that ingests, filters, and transforms data from various sources before sending it to Elasticsearch for indexing. Logstash can handle different types of data, such as logs, metrics, and other event data.
- Kibana: It is a web-based data visualization and exploration tool that works in conjunction with Elasticsearch. Kibana provides a user-friendly interface for searching, analyzing, and visualizing data stored in Elasticsearch. It offers various visualizations, dashboards, and tools to help gain insights from the data.
These three libraries are using together for logs management, monitoring, analysis and troubleshooting in various applications.
Elastic Search is a NoSQL database.
Logstach is a log pipeline tool that accepts inputs from various sources, do some types of transformation based on given criteria, and exports to the different type of visualizations UI applications like Kibana.
Kibana is a open-source visualization UI based library on top of Elastic search library.
In short Logstash collects and parses logs, Elastic search indexes and store this information while Kibana provides a UI layer that provide actionable insights.
First Download the required software libraries:
ElasticSearch- download the latest version of Elastic search from official website.
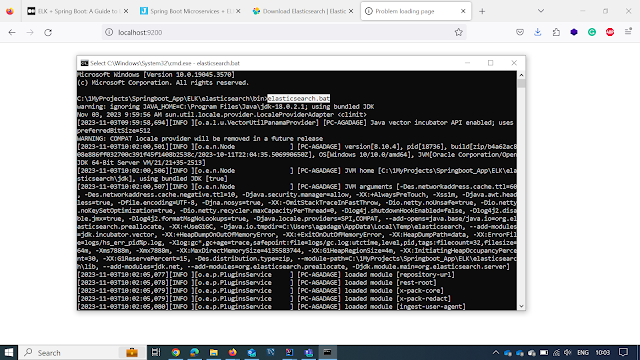
Run the elasticsearch.bat using command prompt from bin directory/folder.
.png) |
| Elasticsearch |
After download elastic search zip from website extract it in anywhere and open bin folder:
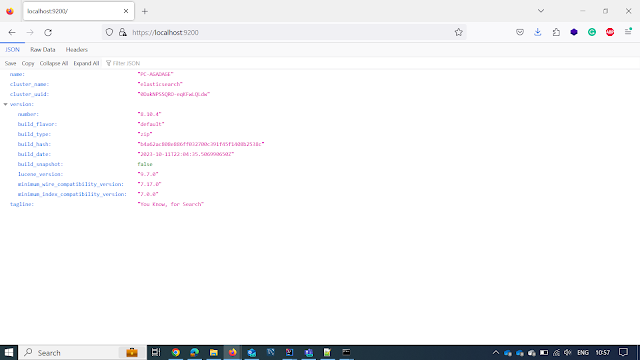 |
| Elastic search dashboard |
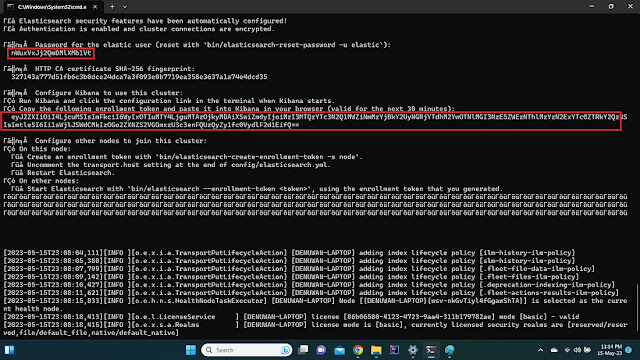
Note. to reset elastic search password go to bin folder of elastic search and open command prompt:
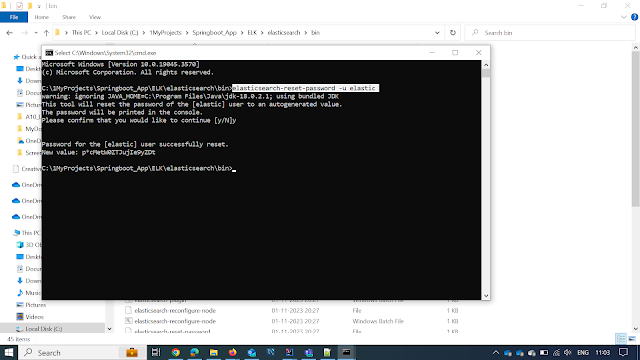 |
| Elastic search password reset |
Now we are able to run elastic search after this will connect elastic search to KIBANA.
.png) |
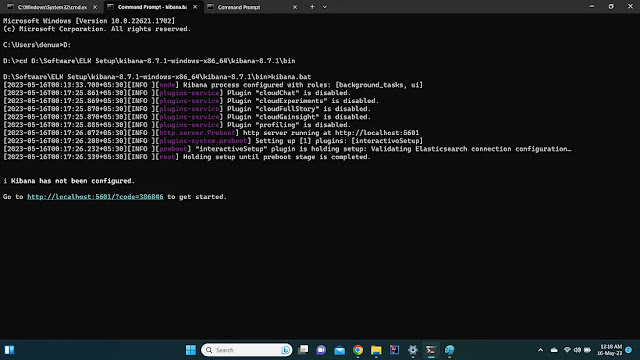
| KIBANA |
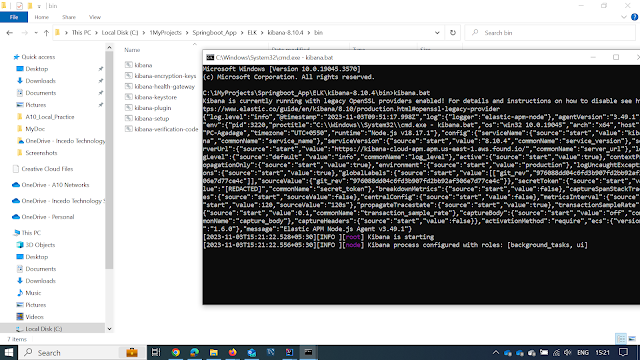 |
| Kibana starting |
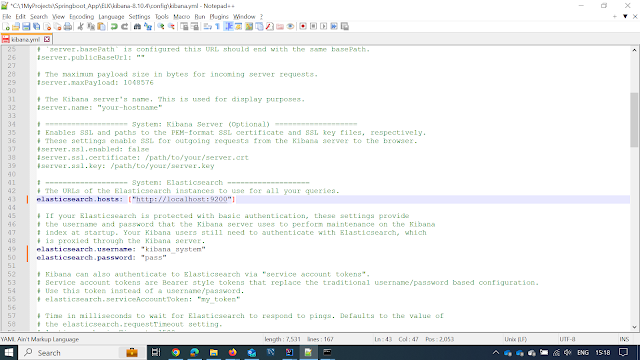
Note: if incase you face any issue generate service account token from elastic search open bin folder in elastic search in command prompt and hit next command elasticsearch-service-tokens.bat create elastic/kibana tkn
bin/elasticsearch-service-tokens
([create <service_account_principal> <token_name>]) |
([list] [<service_account_principal>]) |
([delete <service_account_principal> <token_name>])
 |
| Elastic search service account token |
Download elastic search software.
# Sample Logstash configuration for creating a simple
# Beats -> Logstash -> Elasticsearch pipeline.

input {
  file {
    path => "<Log File Full Path>"
    start_position => "beginning"
  }
}

output {
 stdout {
    codec => rubydebug
  }
  elasticsearch {
    hosts => ["https://localhost:9200"]
    ssl_certificate_verification => false
    ssl => true
    index => "elkdemoindex"
    user => "elastic"
    password => "<Elastic Search Password>"
  }
}logging.file.path= <file path for logs>.logORin application.yml logging:
file:
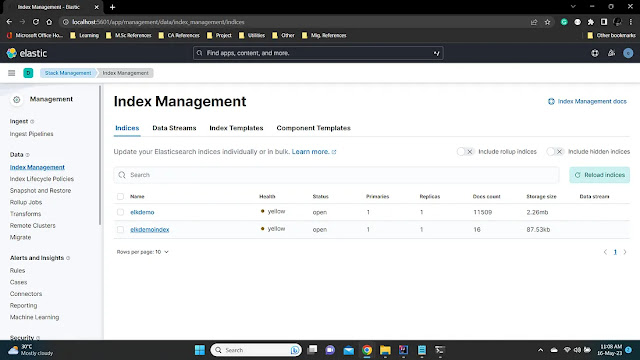
path: <file path for logs>.logCongratulations! Now you are successfully configured ELK + Spring boot stack on your local.
Happy coding!






0 Comments